LLM Model Benchmark — Relog Descriptions
Introduction
As LLM-based geological relogging applications become operational tools in exploration workflows, the choice of the underlying language model directly impacts output quality, cost, and reliability. Different models may vary significantly in their ability to handle ambiguous geological descriptions, assign correct hierarchical lithological classifications, and produce consistent results across repeated inferences.
To support informed model selection, a benchmark was designed using the Butler Property outcrop dataset, introduced in the Butler Property case study. This dataset provides a controlled environment for evaluating models across multiple complementary metrics.
Note
This benchmark is intended as a practical guidance tool for model selection within the Relog Descriptions application. The results reflect a specific dataset and task configuration; performance may vary across other geological contexts, description styles, or application settings.
(Last update: June 2026)
Dataset
To construct a reliable ground-truth dataset from the Butler Property case study outcrop descriptions suitable for benchmarking, the following steps were conducted:
New lithological categories were manually re-defined based on the description content, geological context, and the original field log.
Each description was assigned one or several principal lithologies (\(L_p\)). An outcrop can present several dominant lithologies at or near contacts.
When a lithology is described as subordinate (e.g. a cutting dyke, a minor bed within a sequence), it was assigned as a minority lithology (\(L_m\)).
A confidence score was assigned following the rule: if the interpretation is unique and unambiguous, confidence is high; otherwise, confidence is low.
Particular care was taken during dataset construction to prevent manual labelling errors, requiring multiple review passes.
Evaluation Metrics
The following six metrics are computed per entry on a 0–1 scale and averaged across all realizations:
Main accuracy:
\(A_1 = \begin{cases} 1 & \text{if}\;{L_1 \in L_p} \\ 0 & \text{otherwise} \end{cases}\)
The predicted primary lithology (\(L_1\)) belongs to the ground-truth principal lithology set (\(L_p\))
Secondary accuracy:
\(A_2 = \begin{cases} 1 & \text{if} \; \{L_2,\, L_3\} \subseteq L_p \cup L_m \\ 0 & \text{otherwise} \end{cases}\)
The predicted secondary (\(L_2\)) and tertiary (\(L_3\)) lithologies both belong to the union of principal and minority ground-truth lithologies (\(L_p \cup L_m\))
Confidence:
\(C = \hat{c} = \begin{cases} 1 & \text{if} \; c_{\mathrm{ref}} \\ 0 & \text{otherwise} \end{cases}\)
The predicted confidence level matches the manually assigned confidence level
Hallucination:
\(H = \begin{cases} 1 & \text{if} \; \{L_1,\, L_2,\, L_3\} \subseteq L_p \cup L_m\\ 0 & \text{otherwise} \end{cases}\)
The predicted lithology belongs to either the principal or minority ground-truth. Yields a score of 0 if any predicted lithology falls outside these sets (i.e. a hallucination is detected)
Result stability:
\(R = \max_{i \in \{1,2,3\}} \hat{P}_{\mathrm{hist}}(L_i)\)
The empirical probability that the predicted lithology appeared in prior realizations, taking the maximum value across all predicted lithologies for a given entry:
Stability score:
\(S_{\text{stab}} = \hat{P}_{\mathrm{hist}}(L_1)\)
For each realization, the empirical probability of the predicted primary lithology in preceding occurrences:
Models are ranked by a total score that is a weighted mean of four of the above metrics. Main accuracy receives double weight, reflecting its primacy in the relogging task:
The hallucination and result stability metrics (\(H\) and \(R\)) are reported for diagnostic purposes and are not included in the total score.
Note
Additional datasets will be incorporated in future benchmark iterations to improve the robustness and generalizability of the scores.
Application Setup
The Relog Descriptions application was applied to the Butler Property outcrop descriptions. Three lithological output classes were activated: Primary (\(L_1\)), Secondary (\(L_2\)), and Tertiary (\(L_3\)), with the confidence option enabled. Each model was evaluated under identical configuration conditions to ensure a fair comparison.
Results
Model Scores
Several models were evaluated, as summarized in Fig. 11. Each model is ranked by its
total score \(S_{\text{total}}\) as defined in Evaluation Metrics. Some tested models were found to be
incompatible with the current implementation and are therefore excluded from the comparison. The excluded models
are: claude-haiku-4.5, claude-sonnet-4.6, gemini-2.5-flash, gemini-3.1-flash-lite-preview,
gemini-3.1-pro-preview, and gemma-4-26b-a4b-it.

Fig. 11 Benchmark scores across all compatible models for each of the six evaluation metrics, sorted by total score.
The nine top-ranked models are shown in Fig. 12 as spider diagrams, sorted from best to worst (left to right, top to bottom). The area enclosed by each spider diagram is reported below the corresponding chart.

Fig. 12 Spider diagrams for the nine best-performing models, ranked by overall score.
GPT-5.4, Mistral Medium 3.5, and DeepSeek V4 Flash rank first, second, and third, respectively. With the exception of GPT-5.4, which globally outperforms the field, the remaining models achieve relatively comparable overall scores.
Several observations emerge from the results:
Main accuracy is consistently high across all models, approaching 1 for the majority, indicating strong primary lithology classification performance.
Secondary accuracy is lower and more variable. This metric better reflects a model’s capacity to handle complex, multi-lithology descriptions, making it a more discriminating indicator of model capability.
Confidence is the lowest metric across every model evaluated. This highlights a current limitation of the application: confidence prediction from description text alone is inherently difficult to calibrate. The confidence output should be treated as a qualitative indicator rather than a precise measure.
Hallucination and stability scores are generally high across most models. A visible correlation exists between these metrics and the primary/secondary accuracy scores. Nonetheless, result consistency remains a prerequisite for reliable operational use of a relogging application.
Model Cost
The cost per benchmark run for each tested model is presented in Fig. 13.
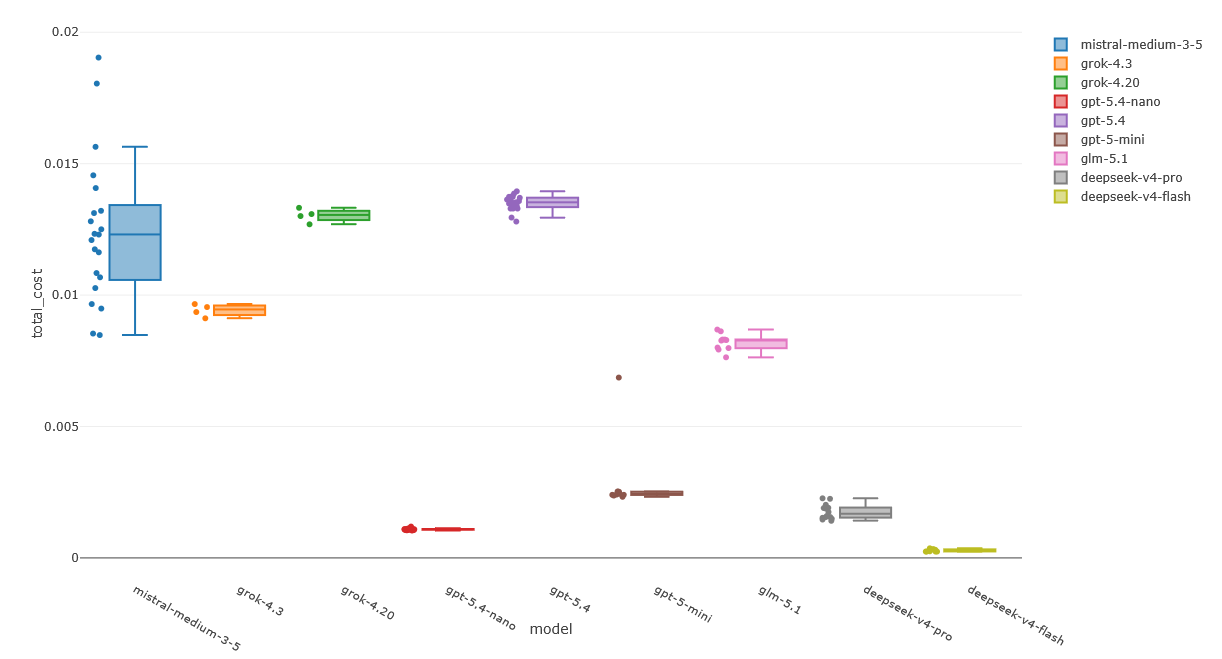
Fig. 13 Cost per benchmark run for selected models.
Two broad cost categories can be distinguished:
Expensive models (~0.01 USD per benchmark run):
Mistral Medium 3.5 exhibits significant variance in cost across individual requests.
Grok models, ChatGPT models, and GLM fall within a similar price range and are comparatively stable between iterations.
Affordable models (~0.0002 USD per benchmark run):
GPT-5.4 Nano, GPT Mini, DeepSeek Pro, and DeepSeek V4 Flash.
DeepSeek V4 Flash is the cheapest model overall, at approximately 0.0002 USD per benchmark run; roughly 50 times less expensive than models in the expensive category.
Model Selection Guidance
Based on the benchmark results, GPT-5.4 is the only model exposed in this application. Its total score significantly outpaces all other evaluated models, with a lead that is consistent across every metric — main accuracy, secondary accuracy, confidence, and stability. No other model approaches its performance profile.
While several other models offer lower cost per request, the performance gap is large enough that the cost difference does not justify the trade-off for a task where classification errors have direct operational consequences on geological interpretation. All other tested models were therefore excluded from the application interface.
Note
Users can configure their own models in the application; however, neither model compatibility nor benchmark-level performance can be guaranteed. In addition, this evaluation is based on a single benchmark dataset and does not ensure equivalent performance on other datasets or geological contexts. Model availability and pricing are subject to change by providers, so current conditions should be verified before production deployment.
(Last update: June 2026)